Home
Here we are building a simple spring boot gradle project using relational database (MySql) and using sonarqube, jacoco, junit, mockito, log4j, pact, project lombock, tools to help to comply with good programming practices which improve the code quality, readability, re-usability, and reduce the cost of development.
Java: 17
SpringBoot: 3.0.2
Jacoco: 0.8.8
Gradle: 8
Sonarqube: 3.5.0.2730
Junit: 5
logback:
Project Overview

SonarQube is an open-source static code analysis tool that helps developers and development teams to manage code quality. It analyzes the source code of your application to identify issues such as bugs, vulnerabilities, code smells, and other potential problems.
SonarQube works by running a set of plugins that perform code analysis and provide feedback on code quality. These plugins can be configured to enforce specific coding standards.
SonarQube can integrate with various build tools and continuous integration systems, such as Jenkins, Maven, Gradle and Azure DevOps, to automatically analyze code as part of the build process. It also has a web-based interface that allows you to drill down into specific issues and explore the code that generated them.
What are bugs?
In SonarQube, bugs are a type of code issue that indicate potential problems in the code that could result in runtime errors or unexpected behavior. Bugs are identified through static code analysis, which examines the code without executing it, and highlights code paths that could lead to a runtime error. For example, SonarQube might identify a bug in your code if it detects an uninitialized variable, a null pointer dereference, or a division by zero. These types of issues can cause crashes, unexpected behavior, or security vulnerabilities if not addressed. SonarQube assigns a severity level to each bug it identifies, ranging from "blocker" for critical issues that prevent the code from functioning correctly, to "minor" for issues that have a low impact. The tool also provides detailed descriptions and recommendations for how to fix each issue, allowing developers to quickly identify and address bugs in their code. By addressing bugs detected by SonarQube, developers can improve the overall quality of their code and reduce the likelihood of runtime errors and security vulnerabilities.
What are Vulnerabilities?
In SonarQube, vulnerabilities are a type of code issue that indicate potential security risks in the code. Vulnerabilities are identified through static code analysis, which examines the code without executing it, and highlights code paths that could be exploited by attackers to gain unauthorized access, modify data, or disrupt the application.
For example, SonarQube might identify a vulnerability in your code if it detects the use of insecure encryption algorithms, the lack of input validation, or the presence of hard-coded credentials. These types of issues can allow attackers to bypass security measures and compromise the application.
SonarQube assigns a severity level to each vulnerability it identifies, ranging from "blocker" for critical security vulnerabilities that must be fixed immediately, to "minor" for issues that have a low impact on security. The tool also provides detailed descriptions and recommendations for how to fix each issue, allowing developers to quickly identify and address vulnerabilities in their code. By addressing vulnerabilities detected by SonarQube, developers can improve the overall security of their code and reduce the likelihood of security breaches and data leaks.
What are code smells?
In SonarQube, code smells are a type of code issue that indicate potential problems in the design or implementation of the code. Code smells are not necessarily bugs or vulnerabilities, but rather patterns or practices in the code that can make it harder to maintain, understand, or evolve over time. For example, SonarQube might identify a code smell in your code if it detects long methods, complex conditional statements, or duplication of code. These types of issues can make the code harder to read, debug, and modify, and can lead to technical debt and reduced productivity. SonarQube assigns a severity level to each code smell it identifies, ranging from "info" for issues that are only a matter of style or convention, to "critical" for issues that have a significant impact on maintainability or performance. The tool also provides detailed descriptions and recommendations for how to fix each issue, allowing developers to quickly identify and address code smells in their code. By addressing code smells detected by SonarQube, developers can improve the overall quality of their code and make it easier to maintain and evolve over time.
What are Security Hotspots in sonarqube?
In SonarQube, Security Hotspots are a type of code issue that indicate potential security vulnerabilities in the code. A Security Hotspot is a code fragment that requires manual review to determine if it contains a security vulnerability. SonarQube uses an algorithm to identify Security Hotspots based on a set of predefined rules that identify code fragments that might contain security vulnerabilities.
Security Hotspots are different from other types of code issues in that they do not represent actual security vulnerabilities, but rather indicate areas of the code that require additional attention from developers to ensure that they are secure. Once a Security Hotspot is identified, it should be reviewed manually by a developer or security expert to determine if it contains a security vulnerability and if any action needs to be taken to address it.
SonarQube assigns a severity level to each Security Hotspot based on the likelihood and impact of a potential security vulnerability. The tool provides detailed descriptions and recommendations for how to review and address each Security Hotspot, allowing developers to quickly identify and address potential security vulnerabilities in their code. By addressing Security Hotspots detected by SonarQube, developers can improve the overall security of their code and reduce the likelihood of security breaches and data leaks.
Step1: go to below address and download latest sonarqube version sonarqube-9.9.0.65466 Community Edition link to download sonarqube
Step2: verify that you must have jdk 11 or jdk 17 installed in your machine. To verify java version use command java -- version

Step3: Extract the downloaded sonarqube zip file in C drive in any folder

Step4: To run your sonarqube server go to bin folder of sonarqube and select in which operating system you want to run Let say I want to run in Window machine then select below path
C:\software\sonarqube-9.9.0.65466\bin\windows-x86-64
Then open command prompt here and type
StartSonar.bat (hit enter)
It will start you sonar server locally
 Step5: To verify sonarqube is up and running
Go to your browser and type
http://localhost:9000/
We will see below interface
Step5: To verify sonarqube is up and running
Go to your browser and type
http://localhost:9000/
We will see below interface

For the very first time it will ask for a username and password. Please remember username will always be admin and password is also admin but later you can change it.
Step1: Go to your Eclipse or STS or IntelliJ Idea Then Go to build.gradle file in your project folder Step2: inside plugin section provide below sonarqube plugin
id "org.sonarqube" version "3.5.0.2730" Step3: refresh your project by right clicking on the project then go to Gradle and refresh the gradle project.

Step4: Now run your sonar Server locally and then go to you browser and type http://localhost:9000/ Login to your sonar server then create a new project on sonar portal by selecting manually create project

Provide your project display name and project Key

Then Click on Set Up Choose locally

Generate you project Token


Select the option of your build tool

After selecting option for build tool it will provide command to run your project

Now go to your Editor and go to your project terminal run below command (make it in single line)
gradlew sonar -Dsonar.projectKey=myfirst-sonar-project -Dsonar.host.url=http://localhost:9000 -Dsonar.login=sqp_0c7a425c87bac0c5d7deb68ddd6da85027c5b594
Hit enter


What is a quality gate?
A Quality Gate is a set of measure-based Boolean conditions. It helps you know immediately whether your project is production-ready. If your current status is not Passed, you'll see which measures caused the problem and the values required to pass.


JaCoCo (Java Code Coverage) is a free and open-source code coverage library for Java projects. It provides developers with insights into how much of their code is being executed during test cases, which helps them identify areas that need more testing. JaCoCo can be integrated with build systems like Maven and Gradle, as well as with continuous integration tools like Jenkins and TeamCity. It supports multiple output formats, including HTML, XML, and CSV, and can be used with a wide range of Java-based applications, including standalone applications, servlets, and web applications.
To support integration with spring boot we must have gradle minimum version 7.3+. With java 17, For java 8 we must have gradle minimum version 2.0+. For java 11 we must have gradle minimum version 5.0+ And for java 19 we must have gradle minimum version 7.6+.
How to download gradle latest version
Visit below link to download gradle latest version, select download binary only https://gradle.org/releases/

**Step to install Gradle in your machine **
In File Explorer right-click on the This PC (or Computer) icon, then click Properties → Advanced System Settings → Environment Variables. Under System Variables select Path, then click Edit. Add an entry for C:\Software\gradle-8.0.1\bin. Click OK to save.

you could also add the environment variable GRADLE_HOME and point this to the unzipped distribution

To verify gradle is installed Go to command prompt and type gradle -v

Now Go to you project in build.gradle file and in your plugin section add below jacoco plugin

To specify version and to generate report please add below lines in your build.gradle file
jacoco{ toolVersion= "0.8.8" } jacocoTestReport { reports { xml.required = false csv.required = false html.outputLocation = layout.buildDirectory.dir('jacocoHtml')
} } tasks.named('test') { useJUnitPlatform() finalizedBy jacocoTestReport }
 To Generate report run below command in your terminal
gradle clean build
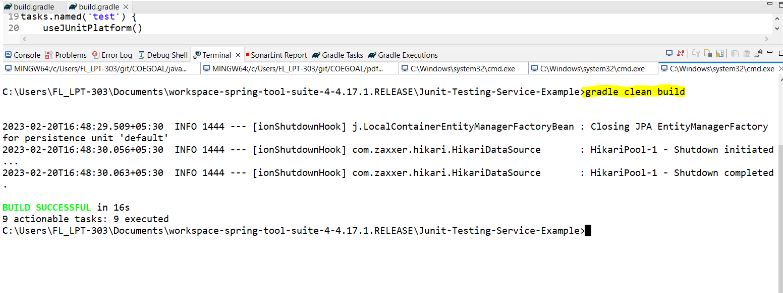
Then refresh your project and go to build folder Inside build folder go to jacocoHTML folder and then open index.html in any browser to see the report

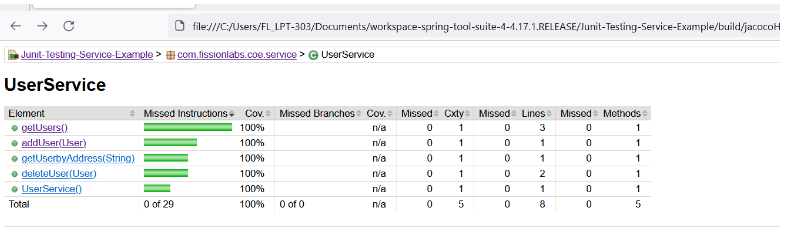
The general color coding scheme that JaCoCo follows is the following: Green – fully covered lines

Yellow – party covered lines (some instructions or branches missed)

Red – lines that have not been executed at all

JaCoCo mainly provides three important metrics:
Lines coverage reflects the amount of code that has been exercised based on the number of Java byte code instructions called by the tests. Branch coverage shows the percent of exercised branches in the code, typically related to if/else and switch statements. Cyclomatic complexity reflects the complexity of code by giving the number of paths needed to cover all the possible paths in a code through linear combination.
JaCoCo runs as a Java agent. It's responsible for instrumenting the byte code while running the tests. JaCoCo drills into each instruction, and shows which lines are exercised during each test.
To gather coverage data, JaCoCo uses ASM for code instrumentation on the fly, receiving events from the JVM Tool Interface in the process.
