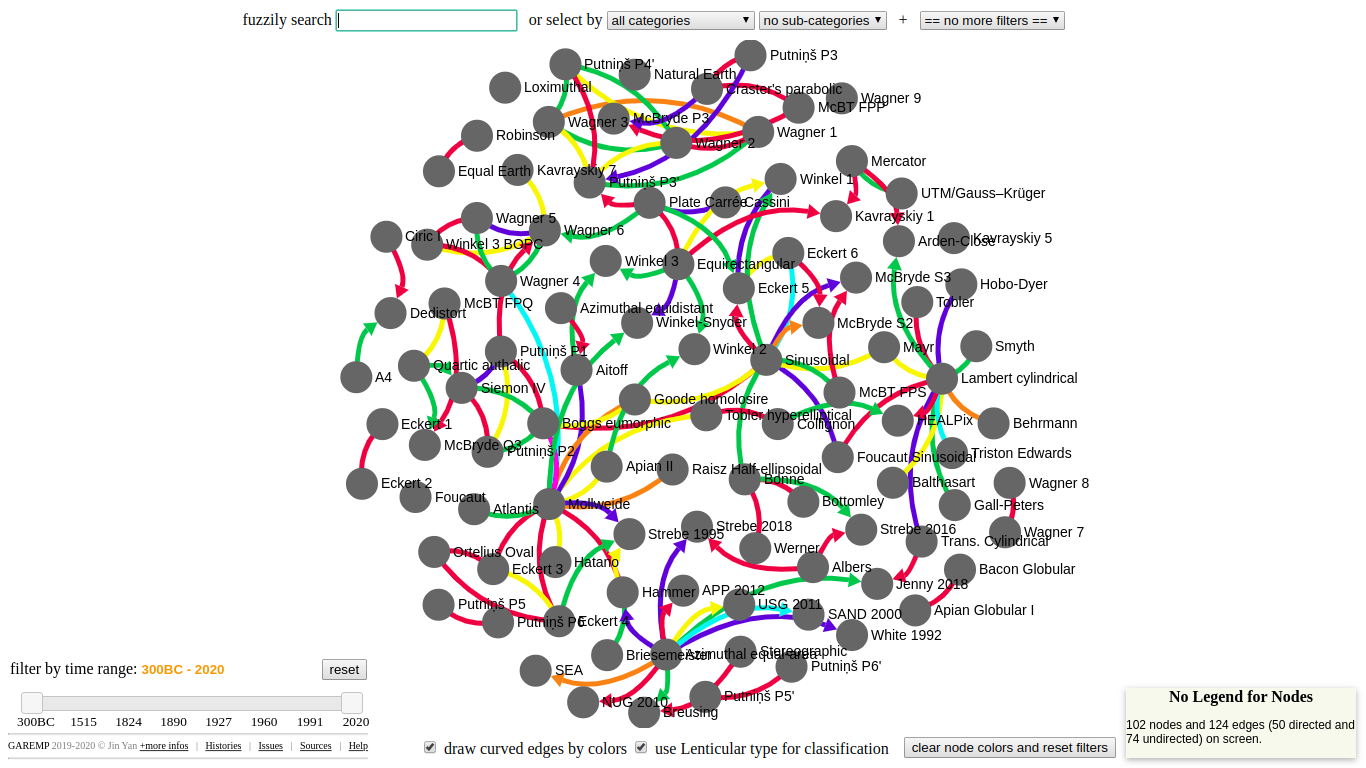
GAREMP: Graphical Attribute and Relationship Explorer for Map Projections
Analyzing and comparing map projections with GAREMP!
Copyright @ 2019-2020 By Jin Yan, from School of Management and Engineering,
Capital University of Economics and Business, Beijing, China
All Right Reserved
A full plain list of map projections used in GAREMP is also available at https://garemp.github.io/list.
Sigma.js (for graph drawing) and jQuery (for page rendering of manipulation) are used in GAREMP.
DataTables (a plug-in for jQuery) is used in the plain list version for contents by sorting, paging, filtering, etc.