Human brain network derived from functional magnetic resonance imaging (fMRI) data are often analyzed and visualize using a combination of MATLAB or network-visualization software (e.g., cytoscape, gephi).
However, much of graph analysis can be accomplished in R. Here, I document a graph-analysis workflow of fMRI resting-state network in R. This allows easy integration with other statistical analysis conducted on the targeted graph measures (e.g., degree, participation coefficient, modularity, system segregation).
This repository includes documentation of the following:
- Manipulate gifti (surface), nifti (volume), cifti (surface + volume) in R to generate network matrices
- Checkout the cifti markdown file for most updated workflow (3/5/2019).
- Most future addition would focus on cifti, as the combination of surface and volumetric data (subcortical) are preferrable.
- Calculate network metrics/measures
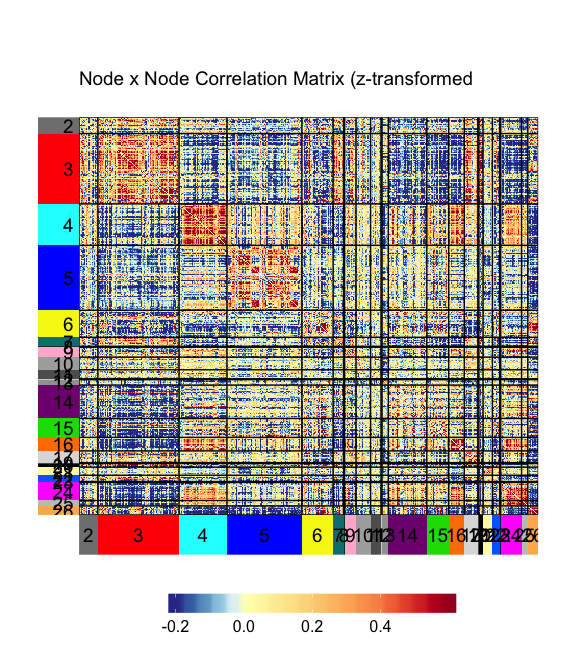
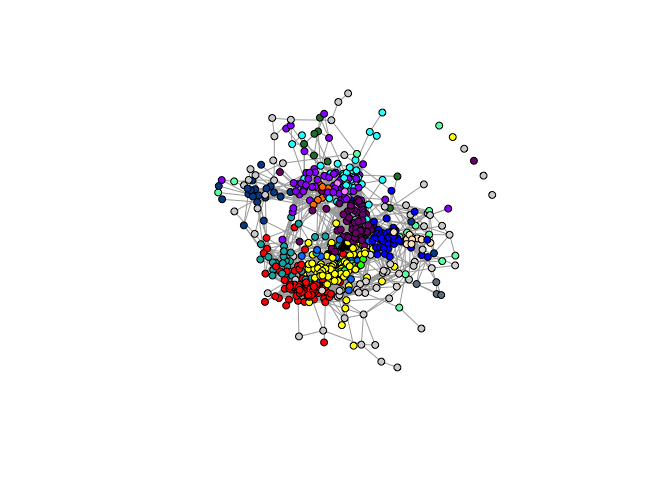
- Visualize network matrices and graphs
- Analyze data
- Visualize results
- The gifti and cifti packages are required to read in gifti or cifti files.
gridExtra&ggplotifyfor arranging the plots.palsfor color pallete.- A forked version of the r package superheat is used for most of the visualization. Example:
- The
igraphis used to make network visualizaiton (i.e., hairball/spring graphs)
- The
superheatpackage was super convenient for my work. Check out the original author's vignette for examples. - The
giftiandciftipackages from John Muschelli are obviously critical for interacting with these data format.