fix the issue that when secondary_y and y are both lists #154
Conversation
|
The main change starts at line 819 in |
|
@xw393 , would you like me to test your fix? |
|
Yes, of course. Thanks!
…On Fri, Jan 11, 2019 at 17:48 pjandrews ***@***.***> wrote:
@xw393 <https://github.com/xw393> , would you like me to test your fix?
—
You are receiving this because you were mentioned.
Reply to this email directly, view it on GitHub
<#154 (comment)>,
or mute the thread
<https://github.com/notifications/unsubscribe-auth/AKKoXW_GCORIbmIdOmxchn2v0OTOQBNzks5vCRTWgaJpZM4YqL9f>
.
|
|
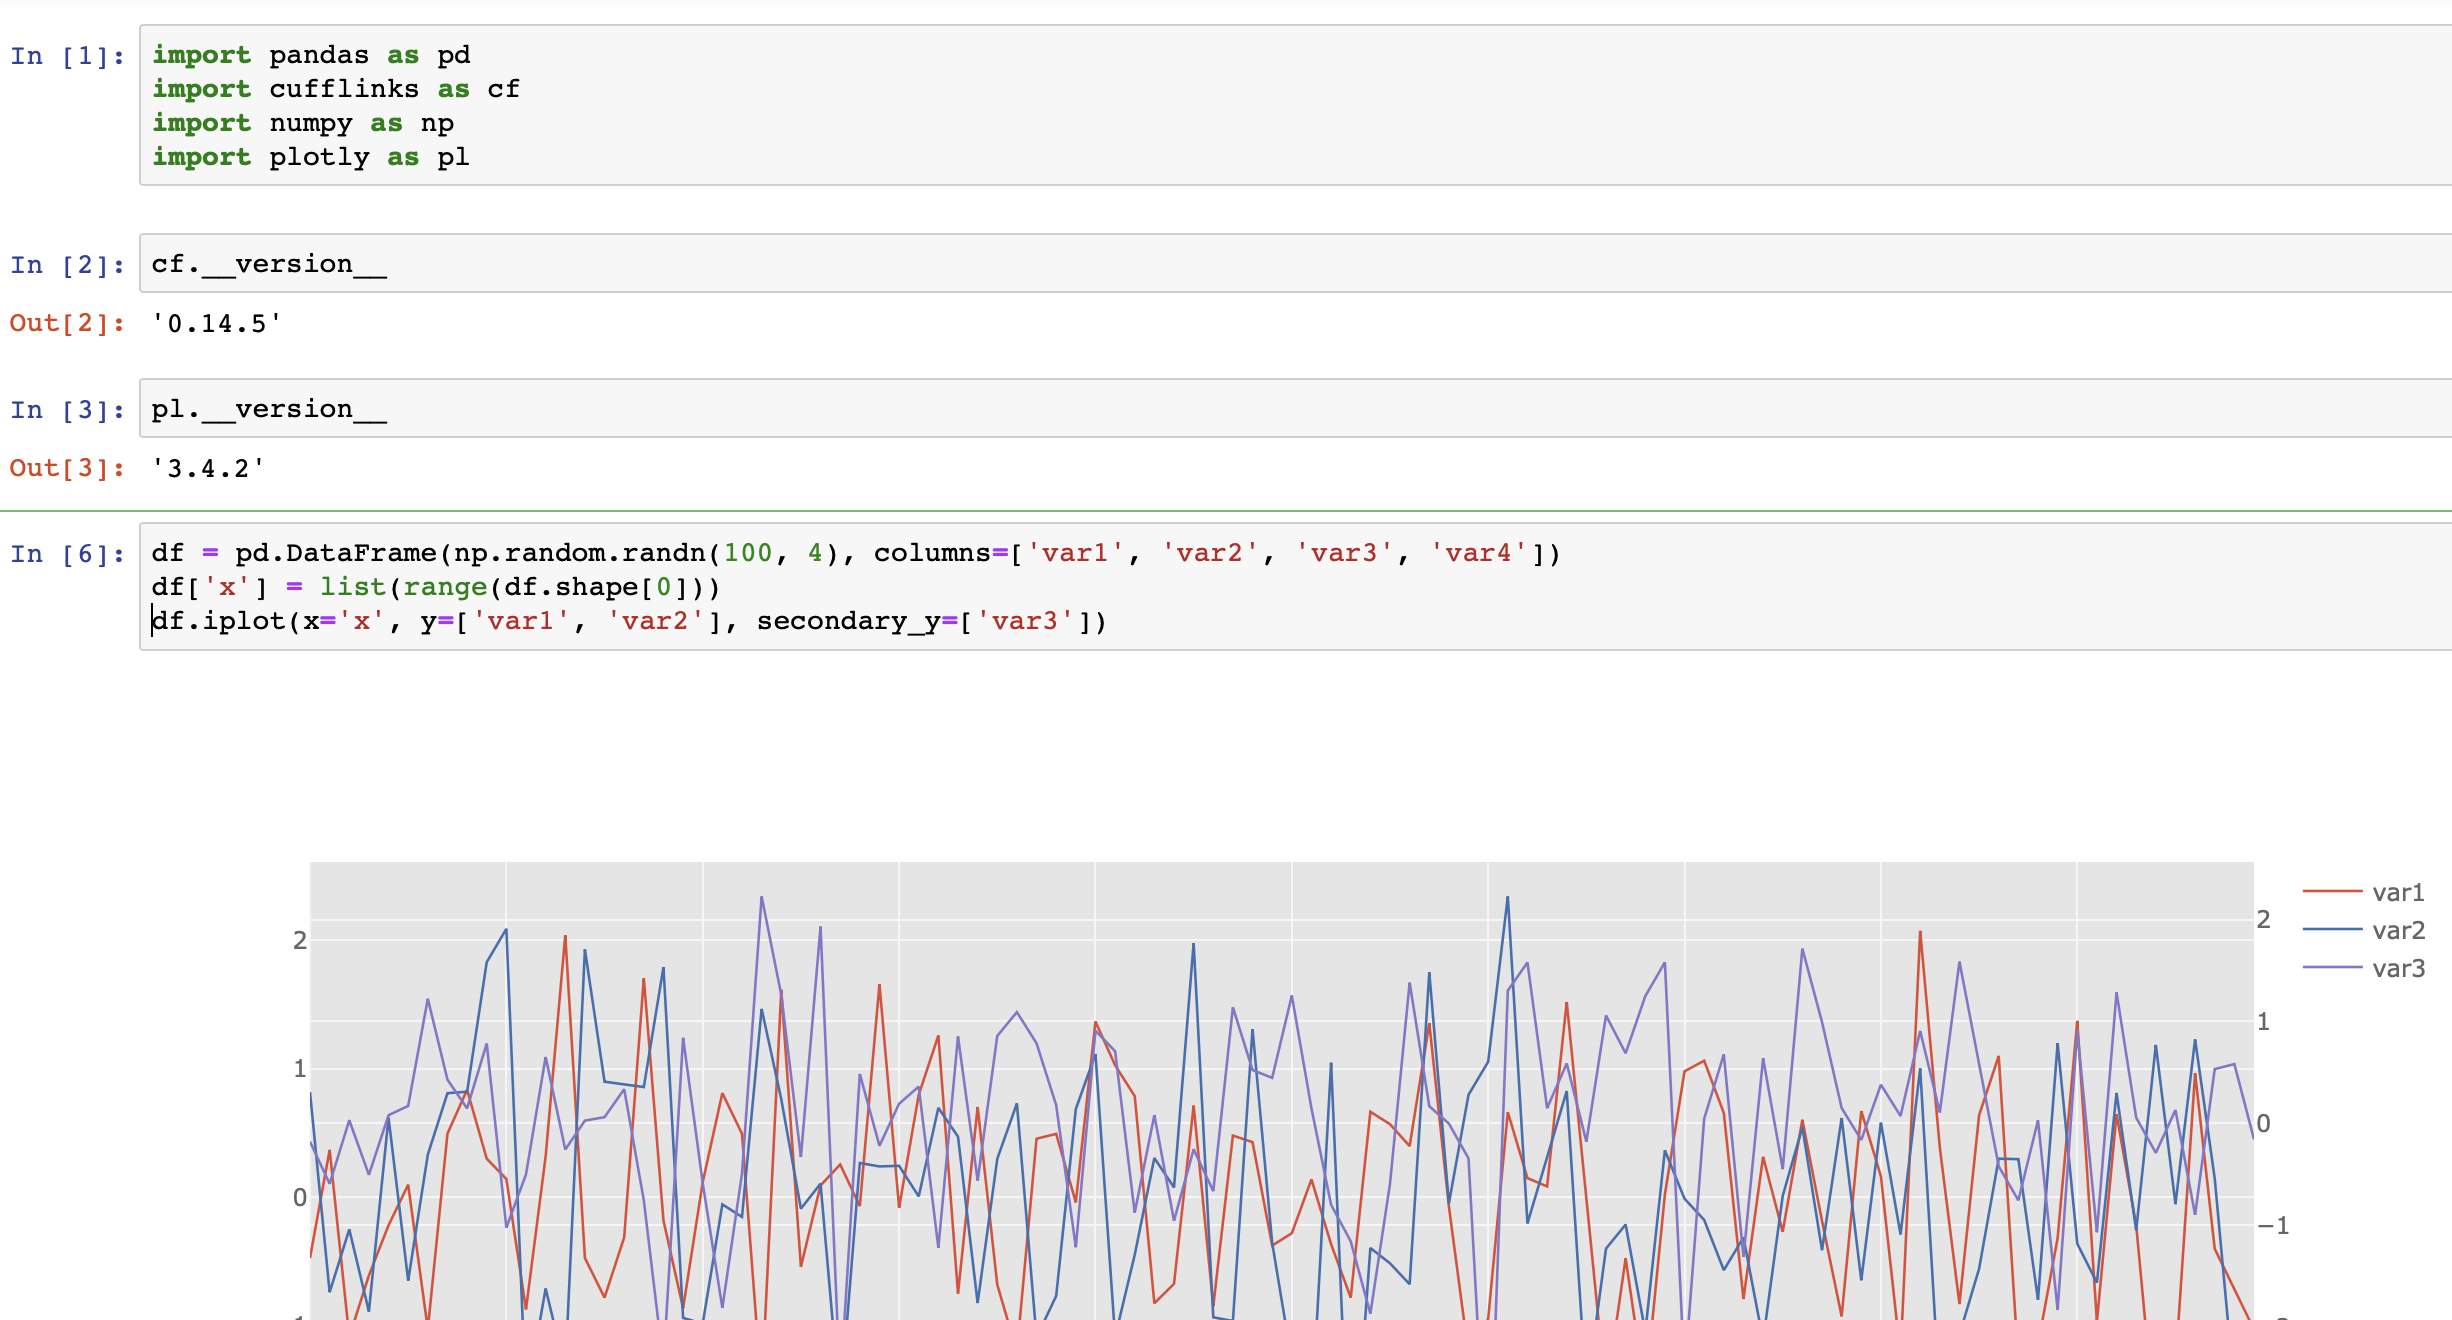
Hi @xw393 , I'm seeing this error after changing plotlytools.py using the example that you gave above. I'm using: plotly 3.4.2 and cufflinks 0.14.5. TypeError Traceback (most recent call last) C:\ProgramData\Anaconda3\lib\site-packages\cufflinks\plotlytools.py in _iplot(self, kind, data, layout, filename, sharing, title, xTitle, yTitle, zTitle, theme, colors, colorscale, fill, width, dash, mode, interpolation, symbol, size, barmode, sortbars, bargap, bargroupgap, bins, histnorm, histfunc, orientation, boxpoints, annotations, keys, bestfit, bestfit_colors, mean, mean_colors, categories, x, y, z, text, gridcolor, zerolinecolor, margin, labels, values, secondary_y, secondary_y_title, subplots, shape, error_x, error_y, error_type, locations, lon, lat, asFrame, asDates, asFigure, asImage, dimensions, asPlot, asUrl, online, **kwargs) C:\ProgramData\Anaconda3\lib\site-packages\pandas\core\frame.py in getitem(self, key) C:\ProgramData\Anaconda3\lib\site-packages\pandas\core\frame.py in _getitem_array(self, key) C:\ProgramData\Anaconda3\lib\site-packages\pandas\core\indexing.py in _convert_to_indexer(self, obj, axis, is_setter) C:\ProgramData\Anaconda3\lib\site-packages\pandas\core\indexes\base.py in get_indexer(self, target, method, limit, tolerance) pandas/_libs/index.pyx in pandas._libs.index.IndexEngine.get_indexer() pandas/_libs/hashtable_class_helper.pxi in pandas._libs.hashtable.PyObjectHashTable.lookup() TypeError: unhashable type: 'list' |
|
Hi @pjandrews, thanks for testing. Based on your error log, it looks like the error is due to line 818- 819 However, in my test code example I created a test env with same as yours, there is no error. BTW, I'm using OS X. Here is a screenshot of my test in the Jupyter Notebook: Can you please check your codes and test again? Thanks! |
|
Thanks @xw393 , my mistake, I imported the libraries again but didn't restart the kernel which is why I was seeing the strange traceback error. It's also working for me now. Thank you so much for the fix! |
|
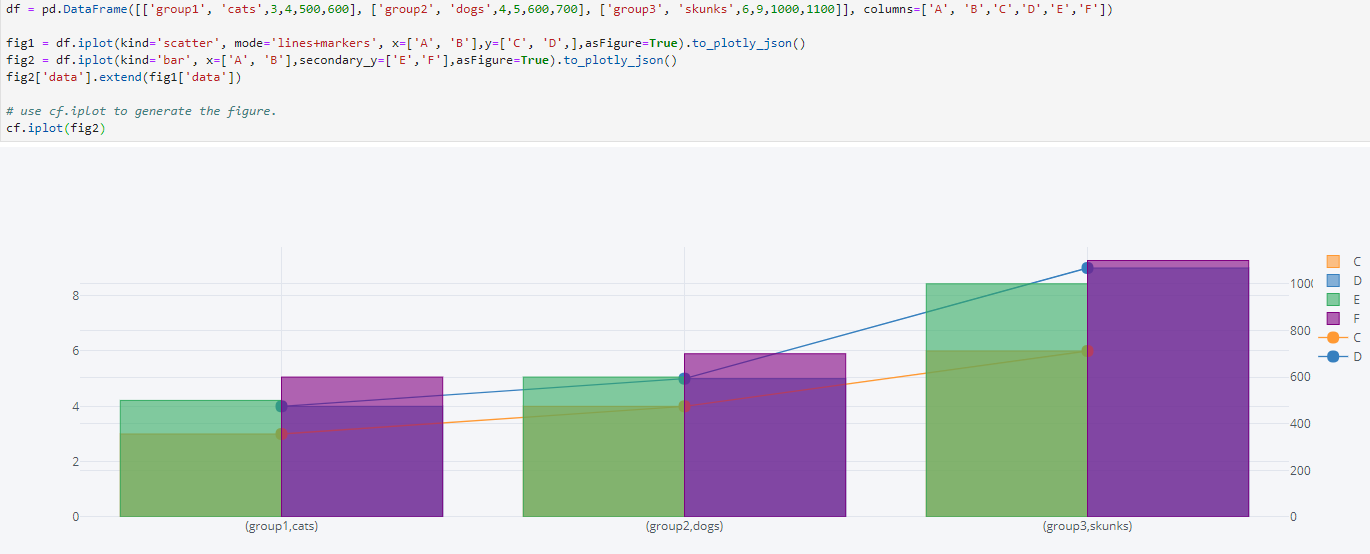
HI @xw393 , it looks like there is still a problem. If I try to create separate figures so that I can include two different types of charts all the columns are included (even the ones that are not specified) in the first figure. Here is an example: df = pd.DataFrame([['group1', 'cats',3,4,500,600], ['group2', 'dogs',4,5,600,700], ['group3', 'skunks',6,9,1000,1100]], columns=['A', 'B','C','D','E','F']) fig1 = df.iplot(kind='scatter', mode='lines+markers', x=['A', 'B'],y=['C', 'D',],asFigure=True).to_plotly_json() |
|
@pjandrews Can you change your code to: |
|
Hi @xw393 I tried with the code that you suggested but am still seeing the same issue. Columns C and D are plotted as Bar and Line plots. Columns C and D should only be represented as line plots.
|
|
@xw393 @timkpaine Just a friendly reminder in case you have a chance to look at this one. Thanks! |
There is an error when secondary_y and y are both lists.
sample code can be:
error:
TypeError: unhashable type: 'list'
Add more conditions to make it more complete. Now, y and secondary_y can be either list and str.