1. Visual
VIAMD does not have restrictions for atom type and can visualize any residue (protein, DNA, organic molecule, solvent,…). However, we recommend to visualize only the essential part of your system and accordingly to remove solvent molecules and ions. The following format are supported by VIAMD: xyz, xmol, pdb, arc (tinker) as well as Gromacs files (gro + xtc). To load a PDB, xyz, or xmol file, click on File>Load Data and choose your file.
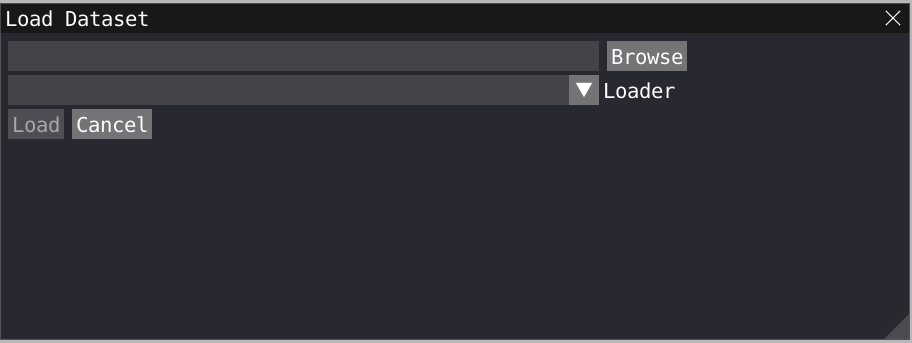
To load a Gromacs geometry file click on File>Load Data and choose your .gro gromacs file. To load a trajectory file on top of the gromacs file, click on File>Load Data and choose your .xtc gromacs file. Important: your xtc file must contain the same number of atom as the gro file.
Alternatively, you can now drag and drop a file in VIAMD to activate the loading window.
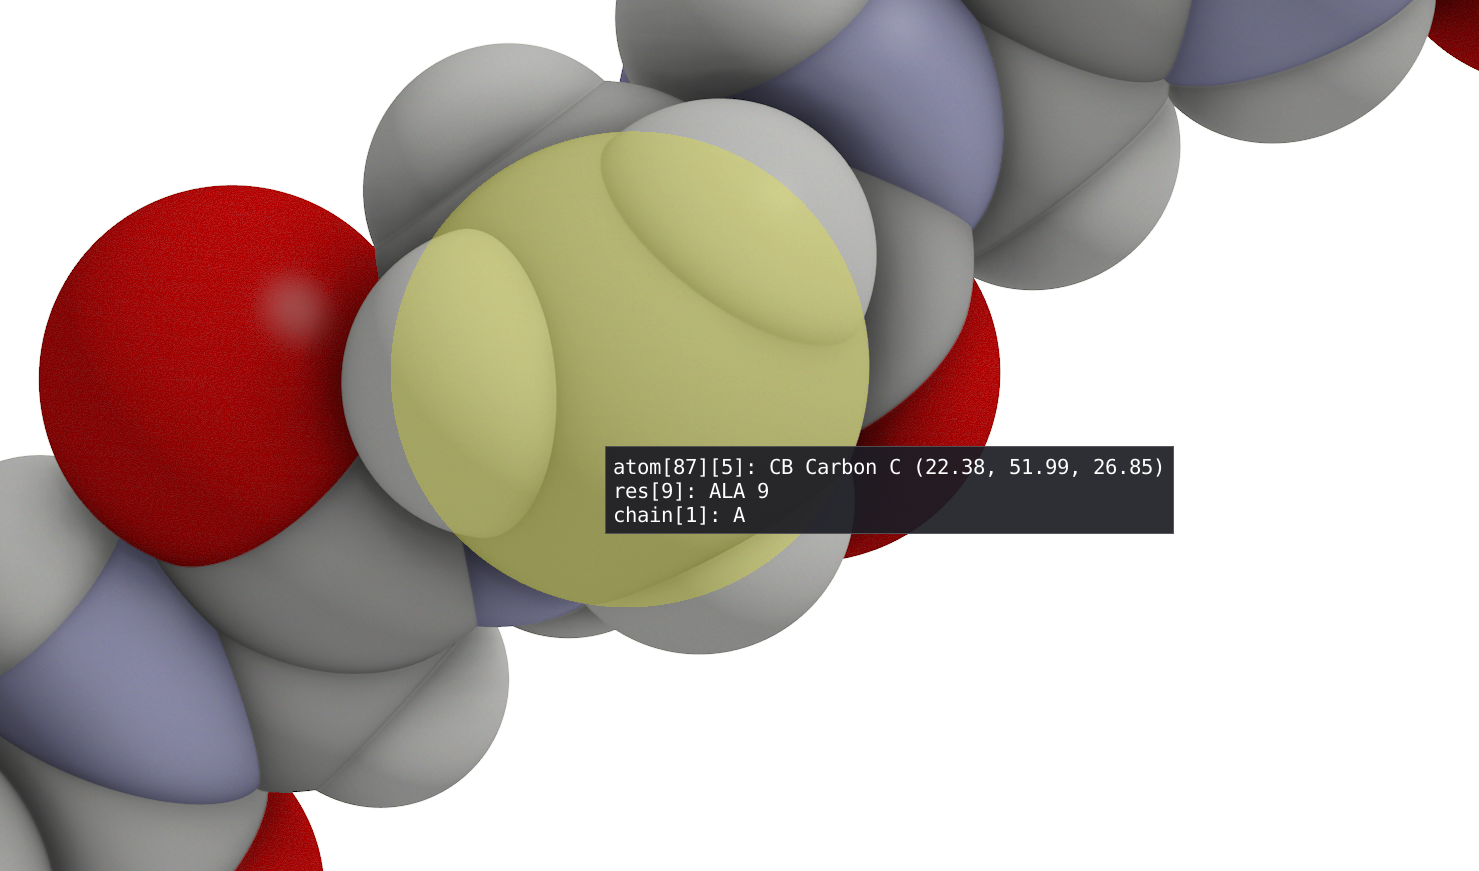
The spatial view shows graphical representation(s) of the molecular structure that can be defined in the Representations window using filtering enabled by VIAMD language. With left-click button of your mouse, you can rotate your 3D model while a right-click will allow translation. A double click on a atom, will recenter the view and the focus of the camera (see Depth of Field) on this specific atom while a double click on empty space will reinitialize the view. By hovering your mouse over an atom, you will find information regarding its number, type, residue, coordinate and so on...
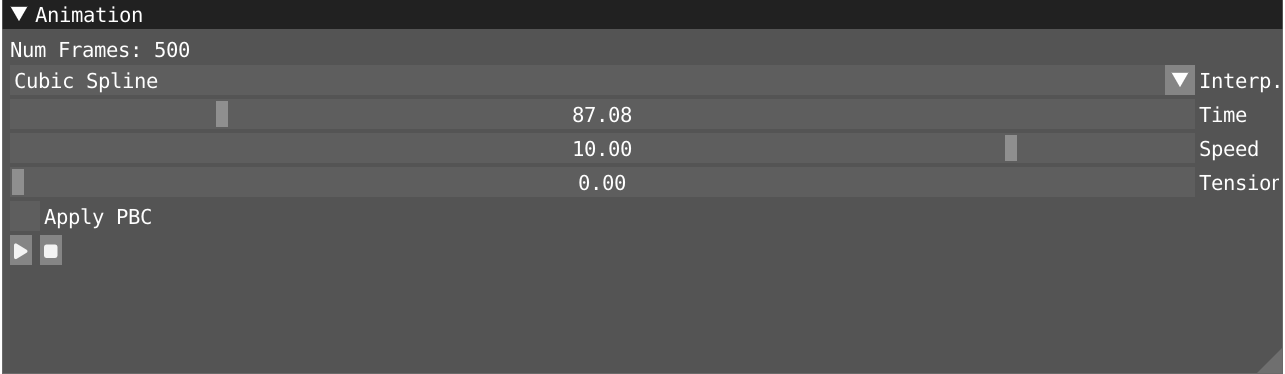
In the animation windows, you can start and pause the animation of your trajectory and use the time slider to navigate through it. Alternatively, in the spatial view, you can use the space bar to start and stop the animation. The speed slider can be used to tune the speed of the animation. Three sort of interpolation methods are provided: nearest, linear and cubic. The interpolation takes into account any periodic boundary conditions (PBC), we recommend the user to deperiodize the interpolated frame by ticking the Apply PBC box.
By clicking on Windows>Representations, you open the representation window where You can create/remove, enabled/disabled, clone and edit different representations for your system: A representation is comprised of a text-based filter using VIAMD language, which evaluates into an atom visibility mask, a visualization type and a color scheme.
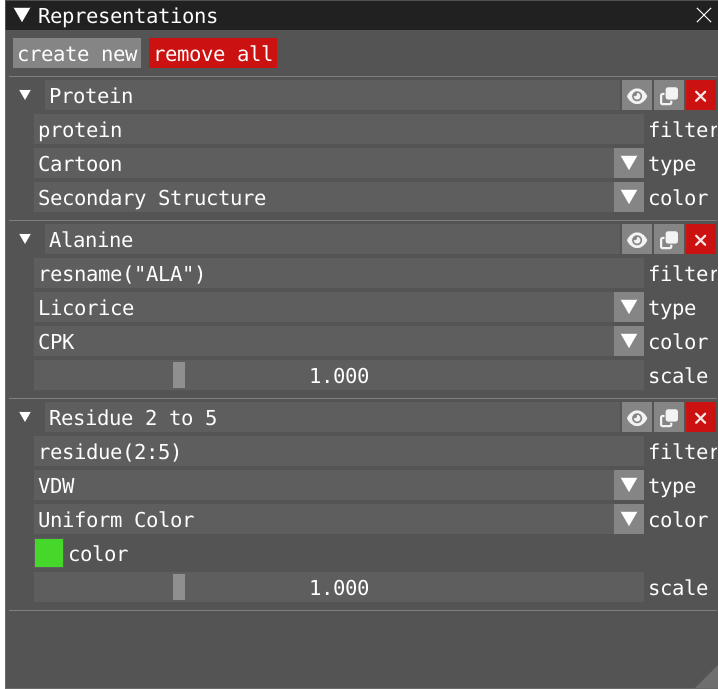
• Spacefill - Atoms are visualized as spheres with a radius defined by the VDW-radius of the atomic element.
• Licorice - Covalent bonds are visualized as capsules connecting atoms.
• Ribbons - The Protein Backbone splines are visualized using a rectangular profile pro- ducing flat ribbons.
• Cartoon - The Protein Backbone splines are visualized using a profile based on its secondary structure, small circular (coil), elliptical (helix) and rectangular (sheet)
• Custom Color - Assign a user defined color.
• CPK - Assign colors by element type, using a predefined palette: Oxygen: Red, Car- bon: Black/Gray, Nitrogen: Blue, Hydrogen: White, etc.
• Atom Type/Label - Assign colors by the atoms label, the color is determined by hashing the atom label yielding a pseudo-random color.
• Atom Index - Assign colors by atom index, the color is determined by hashing the unique atom index yielding a pseudo-random color.
• Element Type - Assign colors by element type, the color is determined by hashing the element type yielding a pseudo-random color.
• Residue Index - Assign colors by residue index, the color is determined by hashing the unique residue index yielding a pseudo-random color.
• Residue Id - Assign colors by residue id, notice that the id is different than the index and is not guaranteed to be unique. The color is determined by hashing the id yielding a pseudo-random color.
• Property - Assign color in function of a property evaluated by the script. Note that for the moment, only a single representation can be colored by property
By right-clicking on an atom or selection of atoms, you will activate a menu allowing you to do the following:
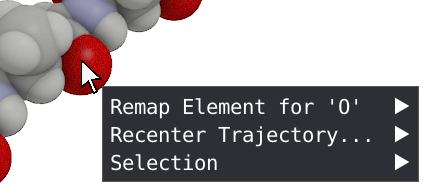
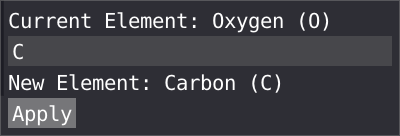
By right clicking on a atom, you can remap a wrongly assign type to a new atom type, this will be propagated to all the atom with the same atom type.
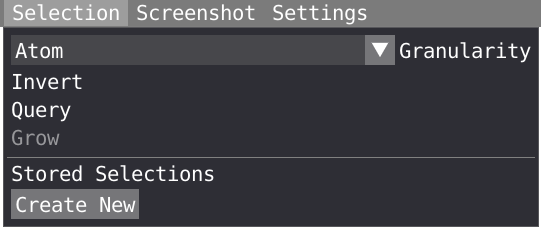
VIAMD supports different ways of selecting and interacting with the data through the different views, but all share some commonalities. In the spatial view, the user can make spatial selections of individual atoms or regions by using a left-click of the mouse in combination with the SHIFT key. To unselect, SHIFT + right-click. With a right-click on the selected region and choosing the Selection menu, you can invert, query or grow your selection.
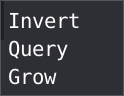
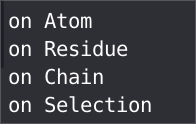
In the selection menu, you can choose your level of granularity (Atom, residue or chain) and grow following covalent bond or radially. Finally your selection can be stored and used later in the script editor or in the representation window.
VIAMD support dynamic re-centering of the trajectory, by selecting an atom, residue, chain or arbitrary set of atoms, the center of mass of that structure is used to recenter the full trajectory. This functionality is accesible by right-clicking on any atom of your system and choosing the Recenter Trajectory menu.
In the Visual window, you can tune several parameters to improve your visualization.
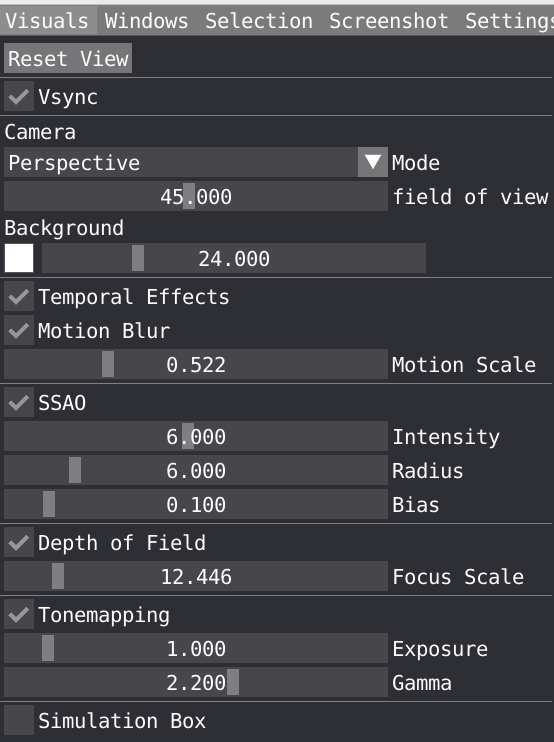
Vsync is short for Vertical Sync which is a boolean to control if it should wait to render next frame until the current one has been fully drawn to screen. It is activated by default and can be disable if you want to control the performance in FPS.
You can choose Camera mode between Orthographic and Perspective and change the field of view for the latter and change the background color and saturation.
Temporal effects is a package feature which includes temporal anti-aliasing and optional motion blur.
You can tune the following Screen Space Ambient Occlusion (SSAO) parameters: Intensity, Radius, Bias. These parameters are important to play with to properly describe shadow in cavity for example.
You can also change the Depth of Field to create some blur effect. Note that the focus of your camera can be changed by double clicking on a specific atom.
Tonemapping: VIAMD internally uses an ad-hoc physically based lighting model with photometric units as floating point numbers that needs to be mapped to the display range (0-255). The tonemapper controls performs this operations and can be configured using parameters such as exposure and gamma to control the curve.
Ticking the box will display the simulation box in the spatial view. you can adjust the width and line color.
The screenshot button will allow you to take a jpg, png or bmp of your 3d view.
Settings allow you to adjust the font size.
