This repository is a progressive project focusing on main concepts which highlights the evolution of Network science in the field of Graph data.

It is a powerful tool for understanding the structure and function of complex systems. It allows researchers to identify patterns and trends in the relationships between the entities in a network and to understand how these relationships influence the behavior of the system as a whole.
There are many reasons why researchers might want to conduct network analysis, including:
- Identifying key influencers: In a social network, for example, network analysis can be used to identify the individuals who have the most connections and are likely to have the greatest influence on the spread of ideas or behaviors.
- Understanding the spread of information: Network analysis can be used to study the flow of information through a network, such as how an idea or rumor spreads through a social network.
- Identifying bottlenecks or vulnerabilities: In a transportation network, network analysis can be used to identify bottlenecks or other congestion points that may affect the network’s performance.
- Analyzing the structure of a network: Network analysis can be used to study the organization of a network, including the patterns of connectivity between the nodes and the overall structure of the network.
- Exploration of Networkx package.
- Degree distribution and Clustering Coefficient
- Preferential attachment
- Node2vec
Degree distribution refers to the probability distribution that describes the number of connections, or degrees, that nodes in a network have. In a network, the degree of a node refers to the number of connections it has with other nodes. The degree distribution, therefore, provides information about the frequency of nodes with different degrees in the network. In a graph or network, nodes are represented as vertices, and connections between nodes are represented as edges. The degree of a node is determined by the number of edges connected to it. The degree distribution of a network describes how many nodes have a certain degree value.
The clustering coefficient is a measure that quantifies the extent to which nodes in a network tend to cluster or form tightly interconnected groups. It provides a measure of the local connectivity within a network and helps understand the presence of clustering or clustering patterns.The clustering coefficient of a node is calculated based on its immediate neighborhood or local subgraph. Let's consider a node A and its neighbors. The clustering coefficient of node A is defined as the proportion of connections that exist among its neighbors divided by the total possible connections among them.

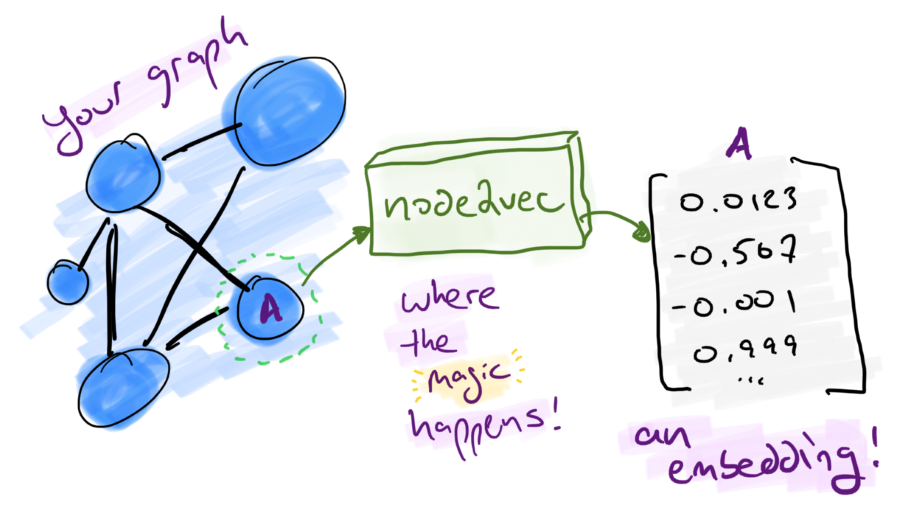
The Node2Vec algorithm explores the network by performing random walks, which are sequences of nodes traversed by randomly following edges. By generating random walks, Node2Vec aims to capture the local neighborhood of nodes and the network's overall structure.
The key idea behind Node2Vec is the notion of node flexibility. It balances between breadth-first search (BFS) and depth-first search (DFS) strategies during random walks. By controlling two parameters, p and q, Node2Vec biases the random walk to explore both local and global network information. Parameter p controls the likelihood of revisiting a node in the random walk, while parameter q determines the tendency to explore nodes within the same neighborhood (BFS-like behavior) or nodes further away (DFS-like behavior).Once the random walks are generated, Node2Vec applies the Skip-gram or Continuous Bag-of-Words (CBOW) algorithm to learn the node embeddings. These embeddings encode the structural relationships between nodes in the network. The resulting node embeddings can be used for various downstream tasks, such as node classification, link prediction, and community detection.